New visualisation platform delivers powerful Earth observation capabilities for marine scientists, with recent support for the PAP Scientific Cruise demonstrating its potential.
NEODAAS is pleased to announce the introduction of a new visualisation platform that enables researchers to explore, analyse and interpret multiple satellite datasets through a single interactive interface. The portal, built using the Syntool platform (https://www.oceandatalab.com/syntool ) is designed to make Earth Observation data more accessible and actionable. It provides scientists with an enhanced view of ocean conditions and processes, helping to bridge the gap between remote sensing and field-based research.
The portal offers access to a wide range of unique environmental datasets NEODAAS are processing, including enhanced ocean colour, chlorophyll concentrations, and thermal fronts together with other products from Copernicus. By bringing together unique NEODAAS products along with openly available data in a single interface, it allows researchers to gain a broader understanding of marine environments and identify features of scientific interest more effectively.
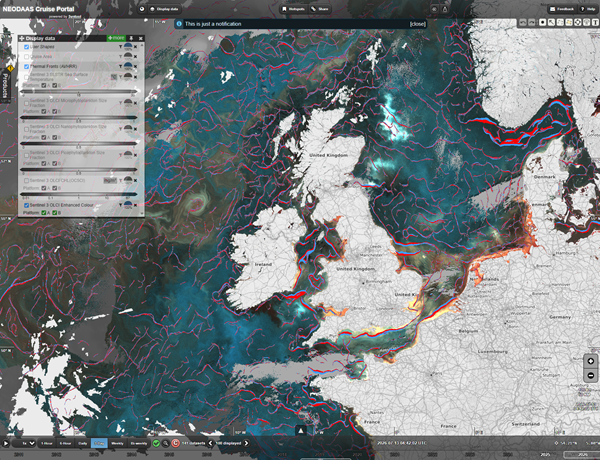
Fig 1: The NEODAAS portal showing two products unique to NEODAAS, enhanced ocean colour data and thermal fronts.
A New Tool for Marine Science Fieldwork
Satellite observations provide an unparalleled view of the ocean, capturing large-scale patterns and processes that are impossible to observe from a single location at sea. These data can be used as a tool to plan targeted in situ sampling, saving time and fuel searching for phenomenon. NEODAAS have a long history of supplying satellite data to support research cruises, previously, providing low-resolution plots of data due to internet bandwidth limitations on research ships. Recent advances in internet connectivity have allowed more interactive tools to be used during research cruises.
Following consultation with NEODAAS users, we have built a portal that provides data commonly used to support research cruises in a single interactive interface. The syntool platform was chosen as it is responsive, easy to use and can easily be customised to fit the requirements of an individual cruise.
Supporting the NERC NOC PAP Scientific Cruise
A recent example of the portal in action was NEODAAS’s support of the Porcupine Abyssal Plain (PAP) Scientific Cruise, which forms part of one of the world’s longest-running open-ocean monitoring programmes in the northeast Atlantic. Annual cruises to the PAP Observatory collect vital measurements that help scientists understand ocean ecosystems, carbon cycling and the impacts of climate change.
The support received positive feedback from the cruise team.
Dr Sue Hartman, Pelagic Team Lead, said:
“..it has been useful to put the Met office buoy data in context – The data you sent spanned before and after the cruise, so we could watch development of the spring bloom.”
Dr Anita Flohr, said:
“[the portal] looks amazing and will be very helpful.
I’d also like to add a big thank you to everyone from the helpdesk who provided daily images prior to and throughout the cruise.”
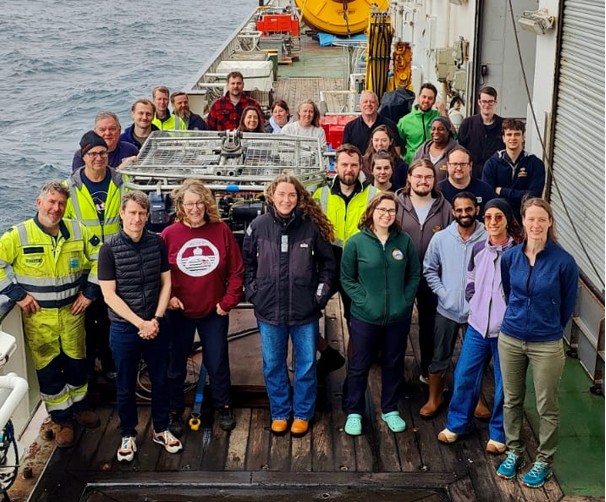
Fig 2: Photo of the science party on the PAP cruise
Revealing the Ocean Through Satellite Imagery
An example of the imagery available through the Syntool portal is shown below: an enhanced ocean colour composite derived from Sentinel-3 OLCI data and visualised within the platform.
The image reveals the dynamic nature of waters surrounding the United Kingdom and northwest Europe. Swirling patterns, frontal boundaries and variations in ocean colour can be seen across the North Sea, Celtic Sea, English Channel and northeast Atlantic. These features are associated with differences in biological productivity, suspended material and water mass characteristics, providing scientists with valuable information about the state of the marine environment.
Particularly striking are the filament-like structures and distinct colour contrasts visible throughout the region, highlighting the influence of ocean circulation and mixing processes. Such features can help researchers identify areas of ecological interest, understand environmental variability and provide context for observations collected during research cruises.
By making these datasets readily available through an intuitive web-based interface, Syntool allows scientists to move beyond individual measurements and view their observations within the wider ocean system.
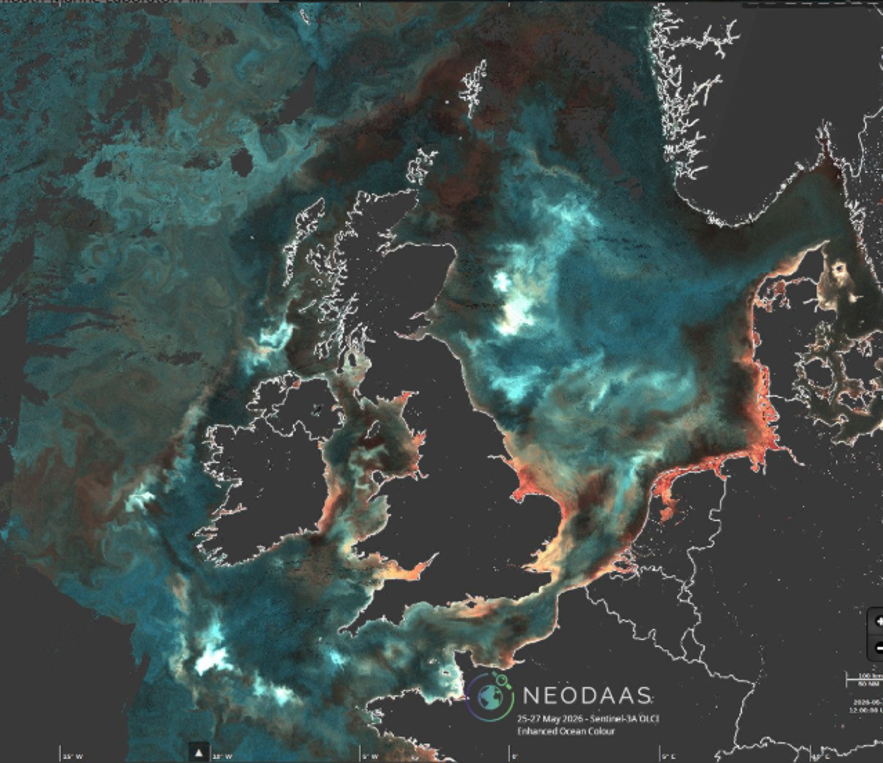
Figure 3. Enhanced ocean colour imagery from Sentinel-3 OLCI displayed in the NEODAAS portal, showing complex oceanographic features around the UK and northwest Europe.
Looking Ahead
The successful use of the Syntool portal during the PAP Scientific Cruise highlights the platform’s potential to support a broad range of marine and environmental science applications. Closer to home, the tool has been used with data collected by the Western Channel Observatory, Whether supporting research cruises, monitoring marine ecosystems, investigating environmental events or exploring long-term trends, the portal provides researchers with a powerful new way to access and interpret Earth observation data.
The portal can be accessed via: https://data.neodaas.ac.uk/cruise/
If you are interested in receiving NEODAAS support or have additional datasets you’d like to be added to the portal please contact us via helpdesk@neodaas.ac.uk.