Looking towards the Benguela region from the Namibia coastline. Image courtesy of NASA
Between 20th August and 18th October 2021, the RV SONNE travelled from Germany to Cape Town and back as part of cruise SO285 investigating the Benguela Upwelling System (BUS). During the cruise, NEODAAS provided email bulletins three times a week with satellite data providing an overview of current conditions around the RV SONNE and the entire Benguela Upwelling System.
The main objective of the research cruise was to capture ecosystem responses to varying physical conditions and the associated impacts on fisheries and sequestration of CO
2, with the overall aim to better understand climate change and human influences on marine ecosystems and the services they provide to society. Satellite data were used to guide the sampling strategy and will later support interpretation of data collected during the cruise.

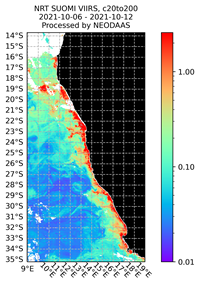
As well as standard satellite derived products, such as chlorophyll concentration and Sea Surface Temperature (SST), NEODAAS provided Phytoplankton Size Class (PSC) data. PSC data is a custom product provided by NEODAAS, based on research undertaken in NCEO (Brewin et al., 2015), derived from satellite data, which shows the chlorophyll concentration and proportion of phytoplankton in pico, nano and micro size classes. For this cruise, data were used from the Visible Infrared Imaging Radiometer Suite (VIIRS) instrument onboard the NOAA Suomi National Polar-orbiting Partnership spacecraft (SNPP).
Chief Scientist of the research cruise,
Tim Rixen from the Leibniz Centre for Tropical Marine Research (ZMT), explained how satellite data were used during the cruise:
“One example where we adapted our sampling strategy to the information we got from NEODAAS was the so-called eddied study. We saw the eddies on your images and adopted our cruise track to it. Within the eddies we used all our gear (CTD, plankton nets etc.,) and compared the sea level height which we extracted from your data to our underway chlorophyll measurements.”
Brewin, R.J., Sathyendranath, S., Jackson, T., Barlow, R., Brotas, V., Airs, R. and Lamont, T., (2015).